Posted on 10 July 2019, updated on 21 December 2023.
You are setting up monitoring and alerting for your Kubernetes Cluster? But don’t know how to do it, which tool to use and what metrics you need. You are at the right place to answer all these in less than 5 min. I will explain why and how to monitor Kubernetes by listing different tools you can use.
Why should you monitor your Kubernetes cluster?
Everyone is talking about monitoring your resources and you could think that it is something you must do but without knowing exactly why. That is because there is a misuse of language: monitoring is usually used to mean “monitoring” AND “alerting” at the same time.
Just monitoring your resources is not that useful if nothing lets you know when there is a problem, and that is why most monitoring tools can be used as alerting tools. To be precise when I will use “monitoring” it will not include “alerting” but keep in mind that on the internet, not everyone does the distinction.
So you should put effective monitoring and alerting on your resources because you want to know before anyone else, especially one of your customers when something goes wrong.
What are the differences between monitoring a Kubernetes Cluster and a traditional Virtual Machine?
Using Kubernetes in your infrastructure changes the way you will monitor it. When you don’t use Kubernetes (nor Swarm), you know exactly where every service of your application is deployed, and this doesn’t change. That is not the case when you use Kubernetes: you don’t know where your pods are because this is not static.
Furthermore, you can scale your infrastructure whenever you want to and so the number of VM (Virtual Machine) you monitor will change: a classic monitoring tool can’t do that.

Your monitoring system has to adapt to all these changes to give you all the metrics you need. So what kind of metrics can you need?
- Kubernetes Node cpu and memory usage, Network, and which services are running: these metrics are the same as you would want even if you don’t use Kubernetes.
- Kubernetes Pod cpu and memory usage, and Network: these metrics will give you the behavior of your pods and more informations about your resource usage.
- Kubernetes Deployment, Cronjobs, and other Kubernetes object state: a global view of your object states (if some execution failed, time since last scheduled time, number of pods from a deployment that are in an available state, etc.)
Which monitoring solutions can you use?
There are three main solutions you can use to monitor Kubernetes, depending on your needs: Prometheus with exporters, Datadog and Kubewatch.
Prometheus
![]()
Prometheus is an open-source tool essentially used in monitoring. Prometheus acts as an aggregator and is not useful alone:
- Applications can expose Prometheus-compatible metrics (some time series in a simple text format) on an HTTP endpoint, usually called /metrics
- You can use exporters which will read and collect data from the application metrics and expose them through a metrics API endpoint (this is needed if the app doesn't have a Prometheus-compatible metrics endpoint)
- Prometheus will regularly scrape these endpoints and save these metrics into a database.
- Prometheus has also service discovery, where a discovery mechanism will find all metrics endpoints on a network and will scrape all these endpoints
- An interface shows your metrics
- An alert manager handles the alerting part

cAdvisor

The most important part about monitoring here is the first one: the exporters. Exporters decide which metrics you have. The Kubernetes exporters I recommend you use are cAdvisor and Kube state metrics. These exporters were made to work with Kubernetes and will grant you all the metrics we talked about sooner. The official documentation is complete and easy to understand. Note that you can use as many exporters as you want to and the community is super-active: exporters exist for all kinds of resources (Database, Messaging system, API, etc.).
Grafana

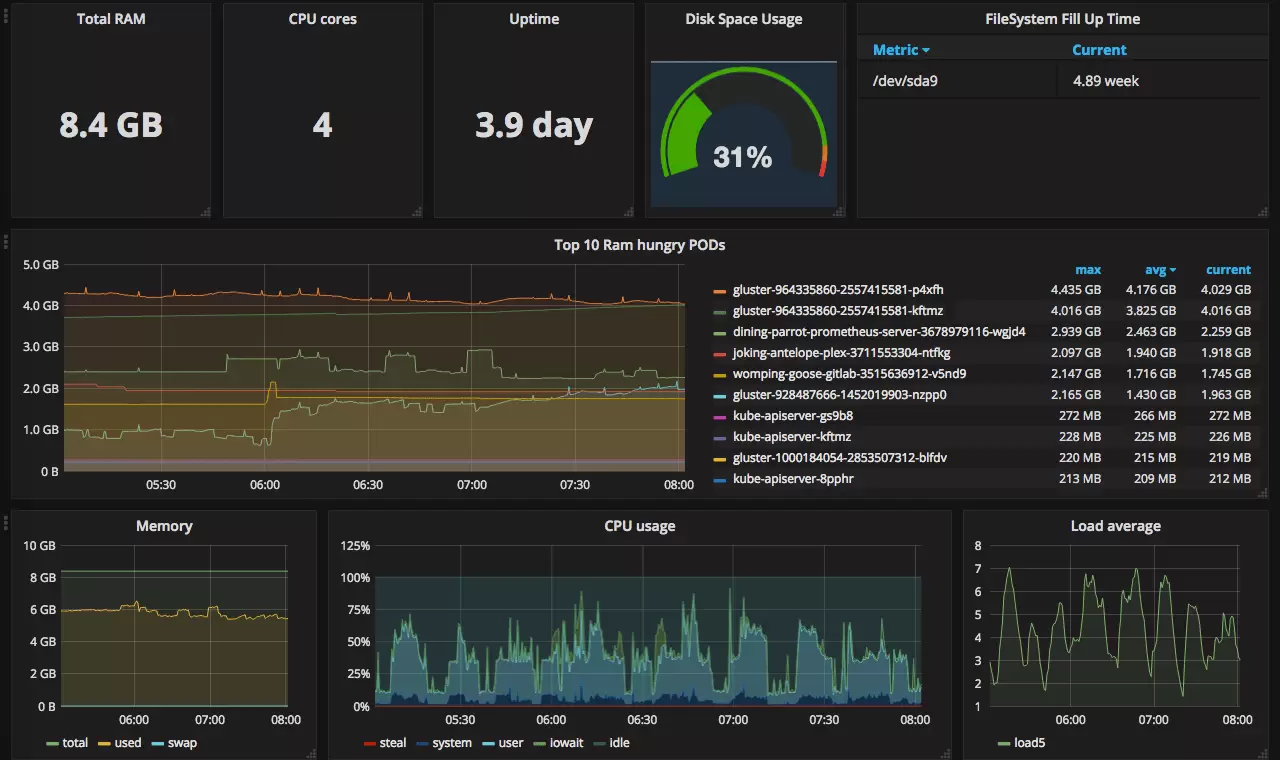
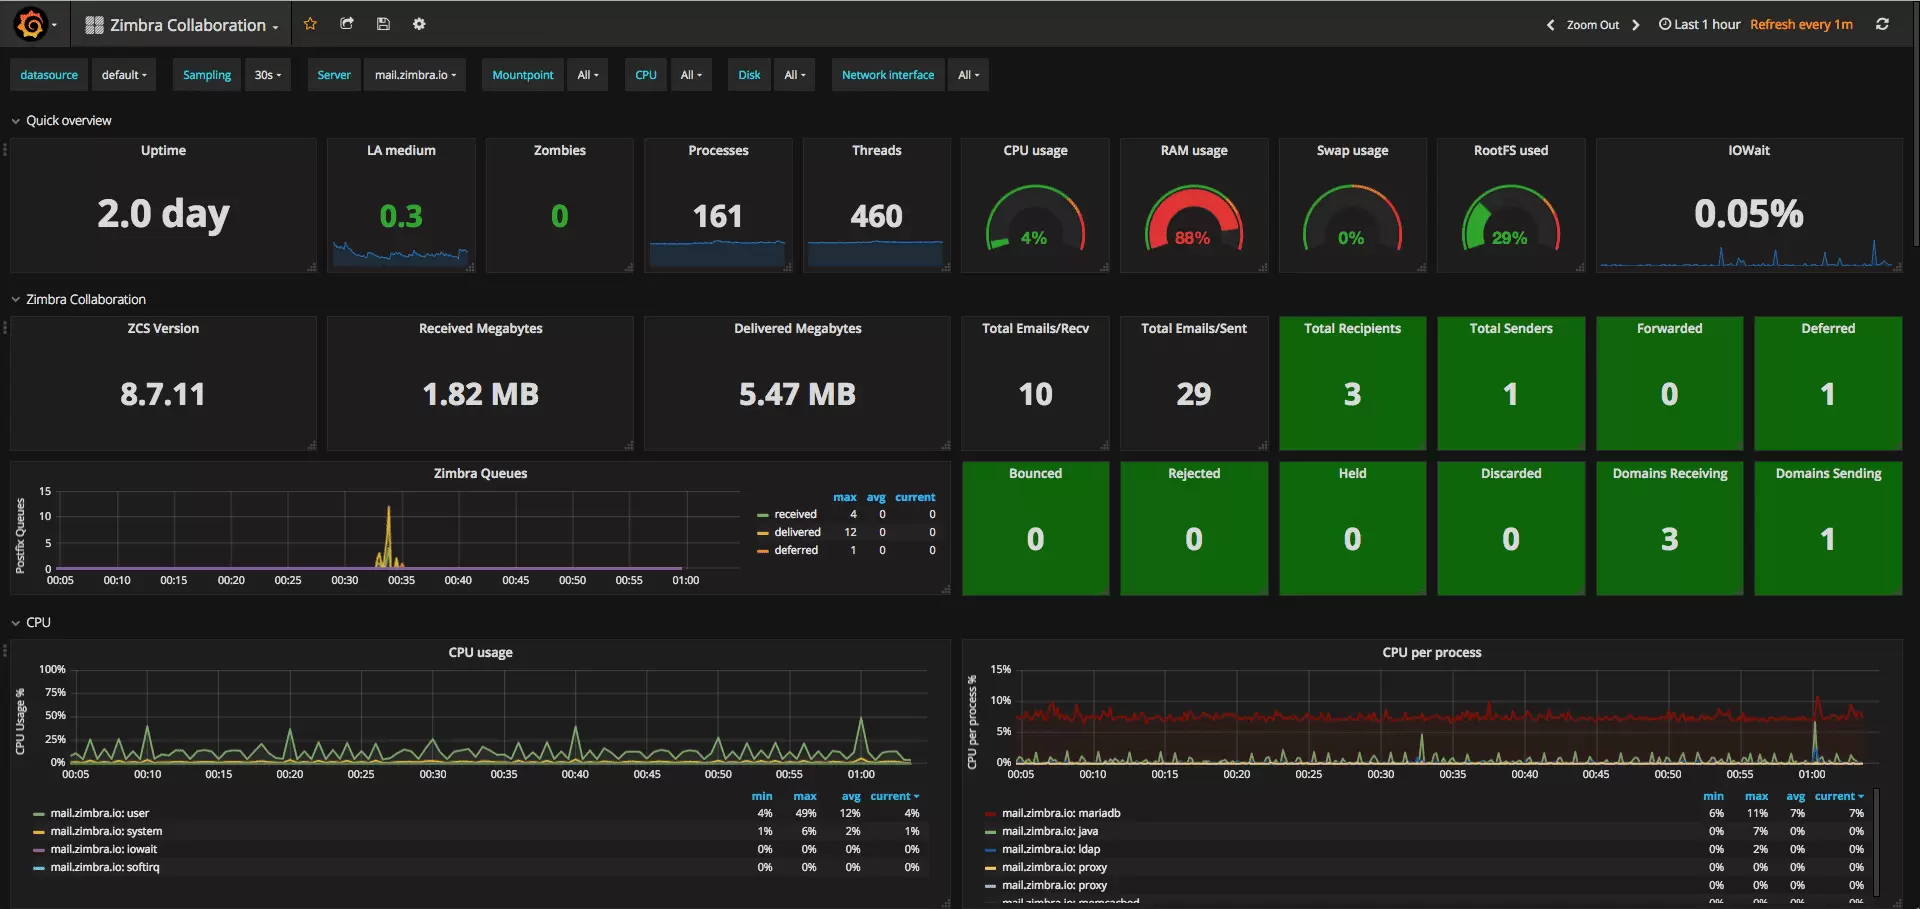
My next advice is for you to use Grafana as the interface. The main point is that Grafana is a tool used to visualize your metrics but also an alerting tool. That means if you deploy your exporters, Prometheus, and Grafana you can set up monitoring and alerting.
Grafana can send an alert on Slack, mail, webhook, or other communication channels. Another key point is the source of your data: Grafana can query several entities at the same time. You can query from databases like ElasticSearch or monitoring tools like Cloudwatch, and even set alerts on it.

Datadog

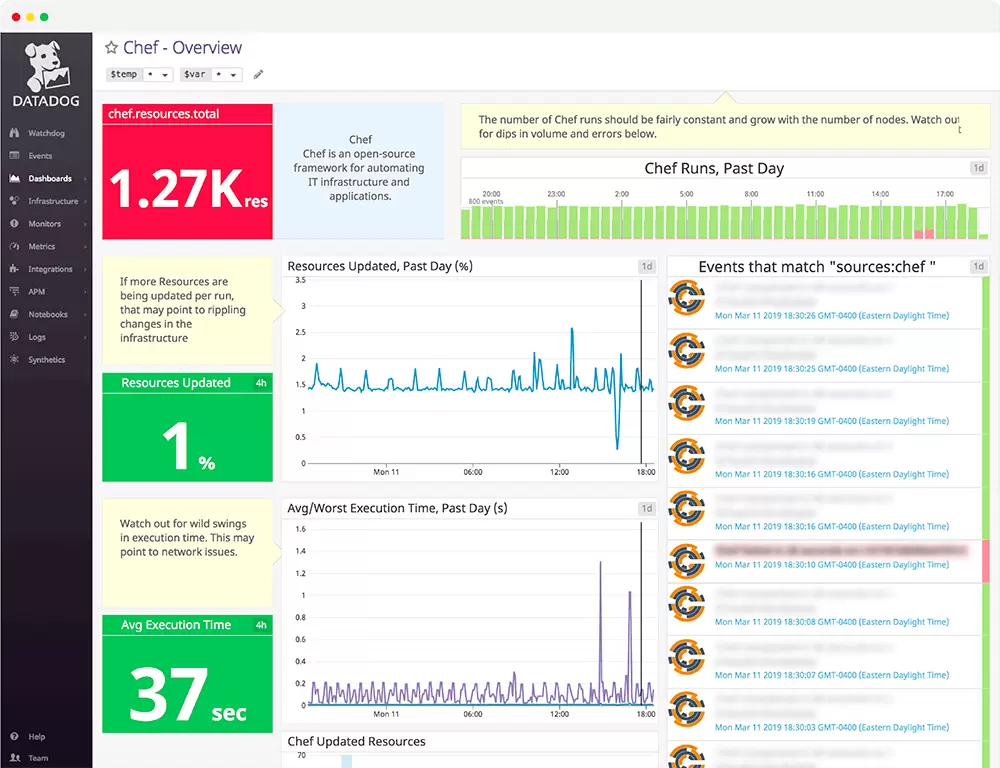
You likely already have heard of Datadog as a tool you can use for your logs. Datadog also has a part to monitor your Kubernetes resources. You can have kubernetes nodes metrics and some of the pods and deployment metrics. When you compare it to Prometheus and all its exporters it’s clear that Datadog can’t match all the metrics but the core point of Datadog is that you can use only one tool to manage your logs and your monitoring.
If you already use Datadog for your logs, setting it up the monitoring is a quick task: you just have to deploy a Datadog Agent which is a daemonset on your cluster. The new pods will collect metrics and you will see them on your Datadog interface.
Datadog is the only monitoring application that you have to pay for it. The cost may be expensive (for the log part) but it comes with support and the assurance of stability. Here is the documentation.

Kubewatch

Kubewatch is used in a different context and can be combined with both upper tools or set alone. Kubewatch is deployed as a Kubernetes object and will send a Slack notification every time something is applied to your cluster:
- If you create a new resource;
- If you delete a resource;
- If you modify a resource;
- Even manual actions are triggered.
You can configure for which Kubernetes resources you want to be notified. That’s an easy tool to set up and the documentation is clean: https://github.com/bitnami-labs/kubewatch
Now you are able to choose what monitoring tool is best for your Kubernetes Cluster depending on your working context:
| Tool | + | - |
| Prometheus |
Free |
Longer to install |
| Datadog |
Quick to set up |
Expensive |
| Kubewatch |
Easy to install |
Doesn’t provide metrics but operations on your cluster |
This list is not exhaustive but describes all principal Kubernetes monitoring tools at the moment.
If you have questions or need help with monitoring tools? Contact us.
Also, check out our articles about Kubernetes productivity tips or Kubernetes secrets to go further on Kubernetes usage.

